Exotel Call Analytics
Monitor, analyse and derive insights from voice communication data.
THE CONTEXT
Exotel is a cloud telephony platform. It powers voice and SMS communication of businesses. The customer base of Exotel covers both small businesses and large enterprises. As customer communication is concerned, it is important to analyse the interactions both quantitatively and qualitatively. In some cases, it is a direct measure of customer experience for example average call time in a call centre. In some other situations, those measurements translate to operational efficiency, for example, the number of call per order for e-commerce.
Understanding the problem
The product has an extensive reporting for calls and SMS. Through customer interviews and support queries it was evident that people are having difficulties in getting an overview of the calls and SMS. To get the overview, they need to go through multiple steps.
- Download the reports
- Visualise it with the help of Excel sheets or data visualisation tools
In customer interviews, people often talked about these problems.
The Goal
Based on the above findings, we decided to come up with an analytics dashboard for calls which gives an overview both in real-time and historically.
My Role
I was responsible for research and design. I worked along with product managers and engineers. Also, involved sales, customer success and customer support teams throughout the process.
One product and many use cases
Once subscribed to the service, it is up to the customers to use it according to their need. Different customers are using it for various use cases. Most common ones are contact centre, marketplace support and logistics operations.
Identifying the information that matters
Various data points can be included in the dashboard. However, it is crucial to understand the goals of the users and show the relevant information that helps decision making. Customer interviews, support tickets and internal feedbacks from sales, support and customer success helped to identify the goals.
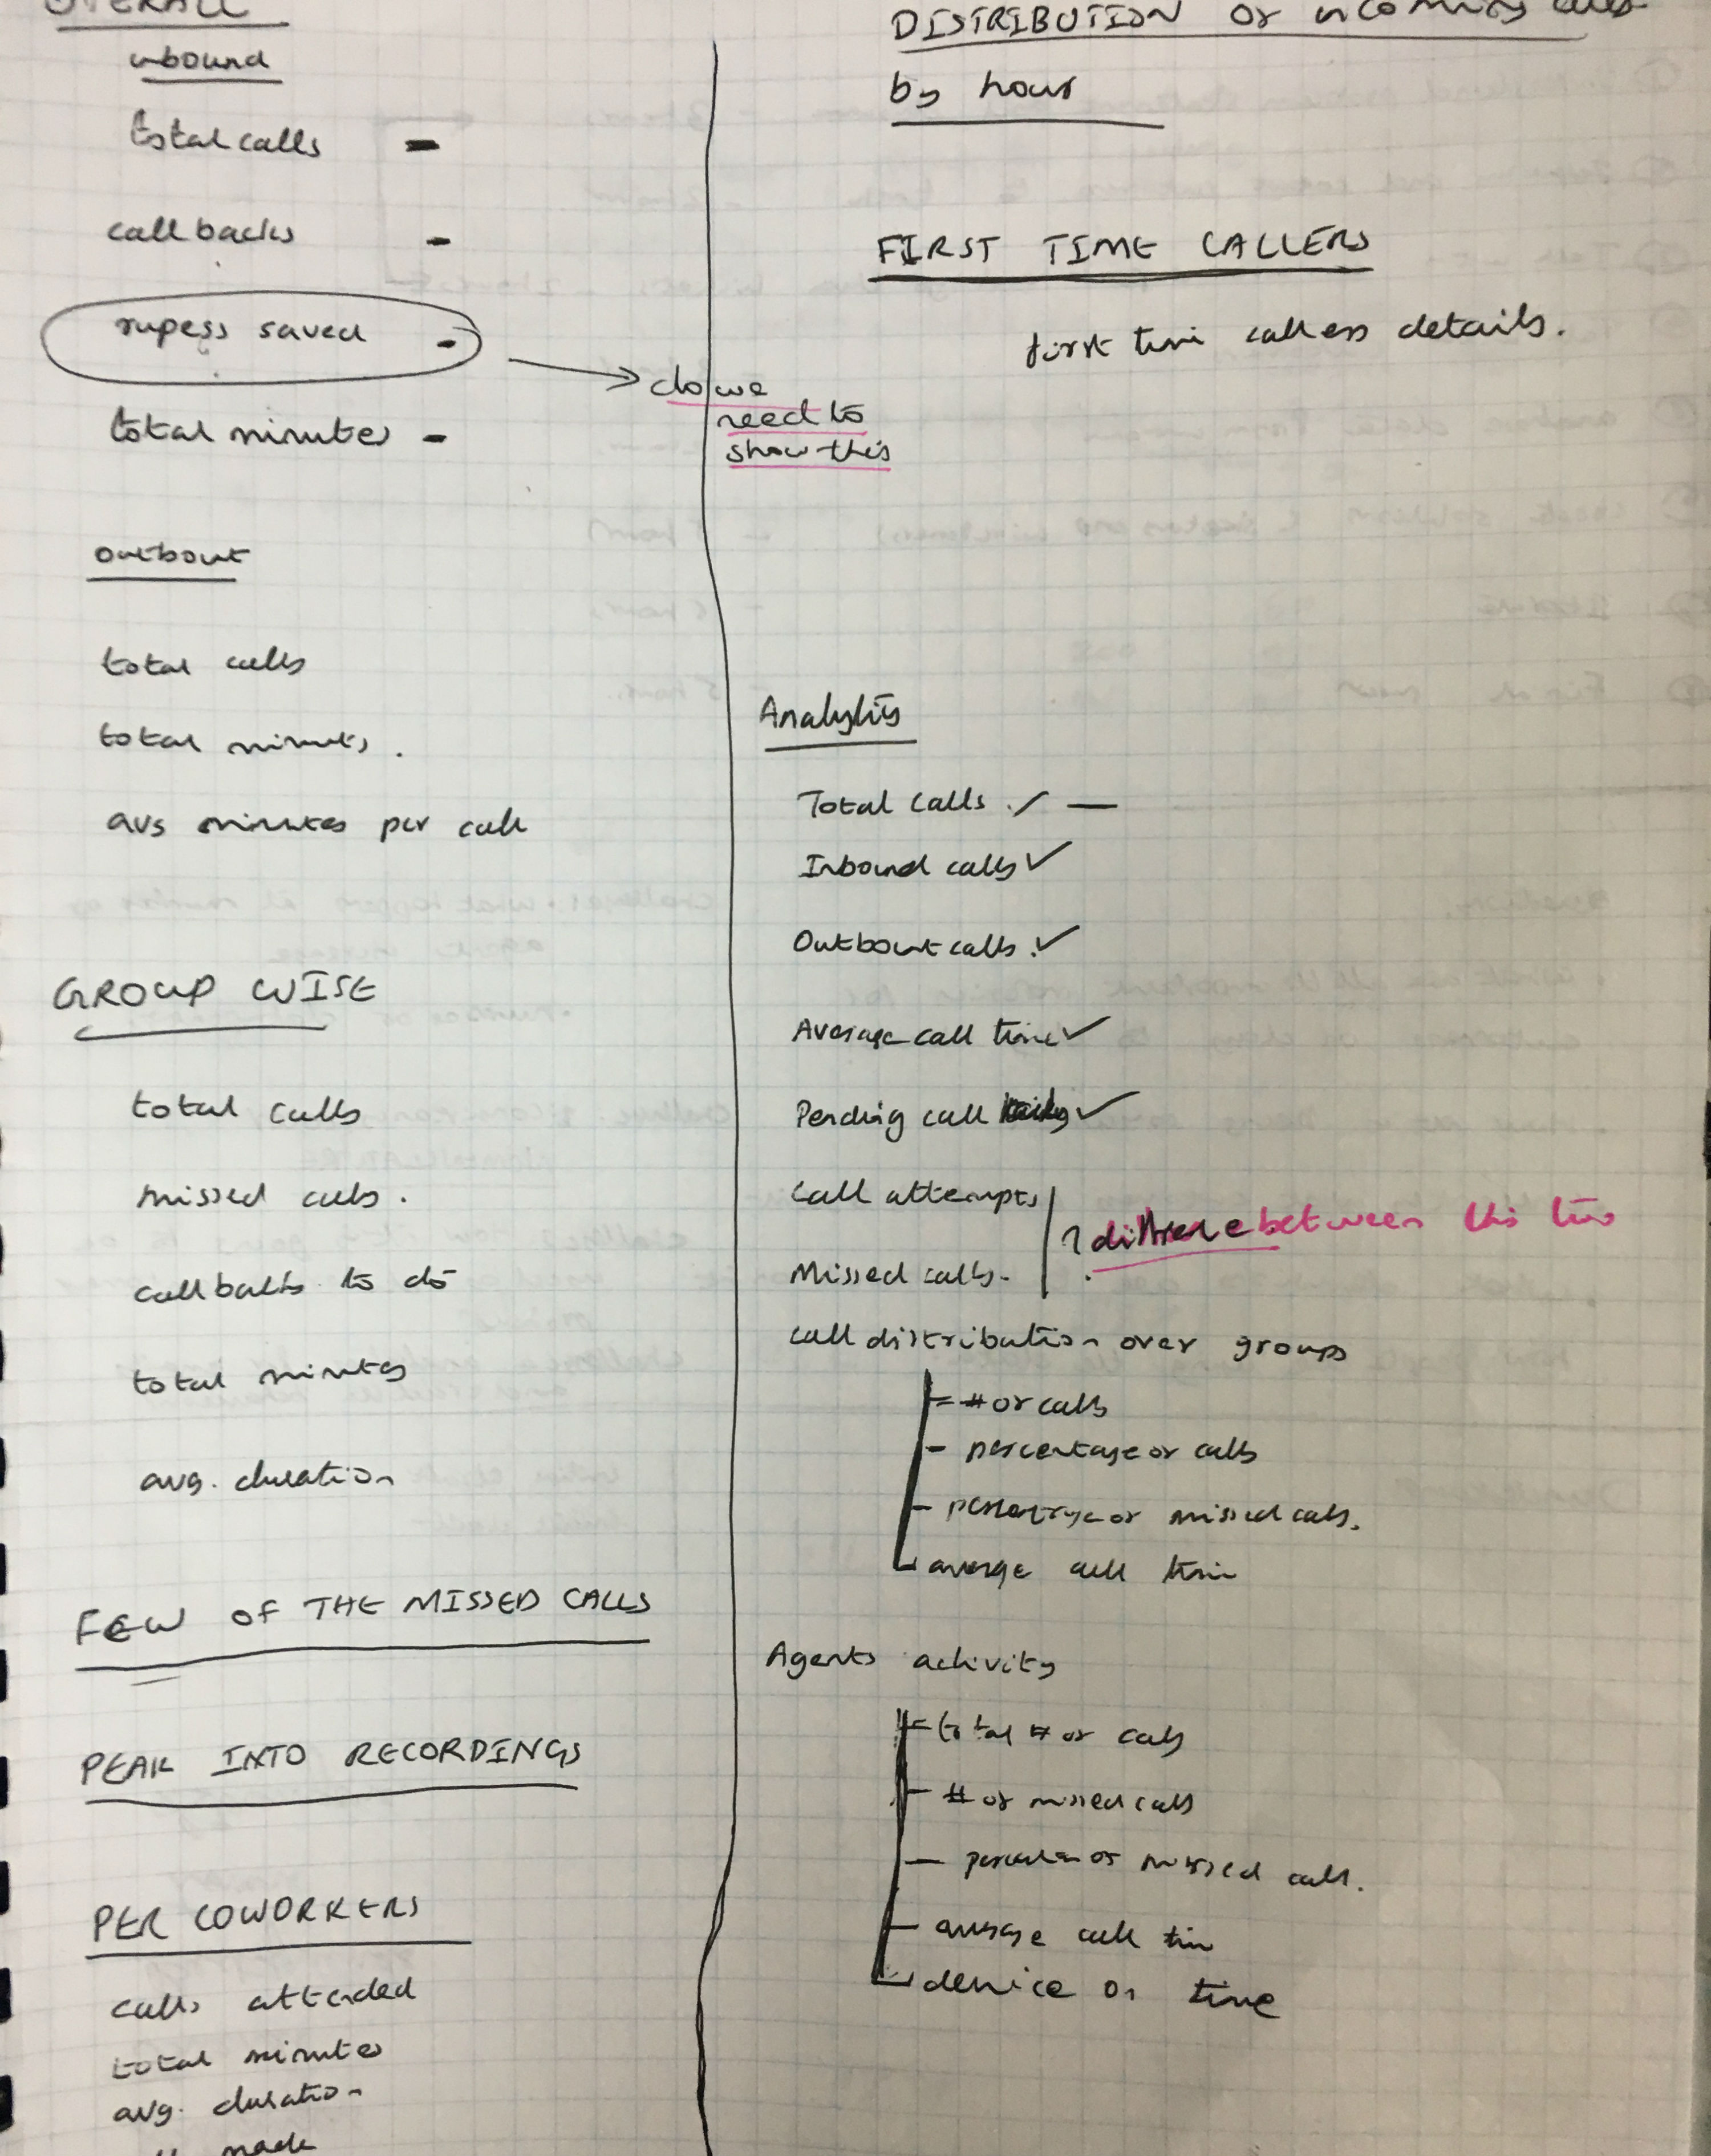
Another thing to consider was the relationship between those goals and the use cases. Identification of patterns helped us to come up with the information, its architecture and display.
Three levels of awareness
The dashboard organises the information into three categories.
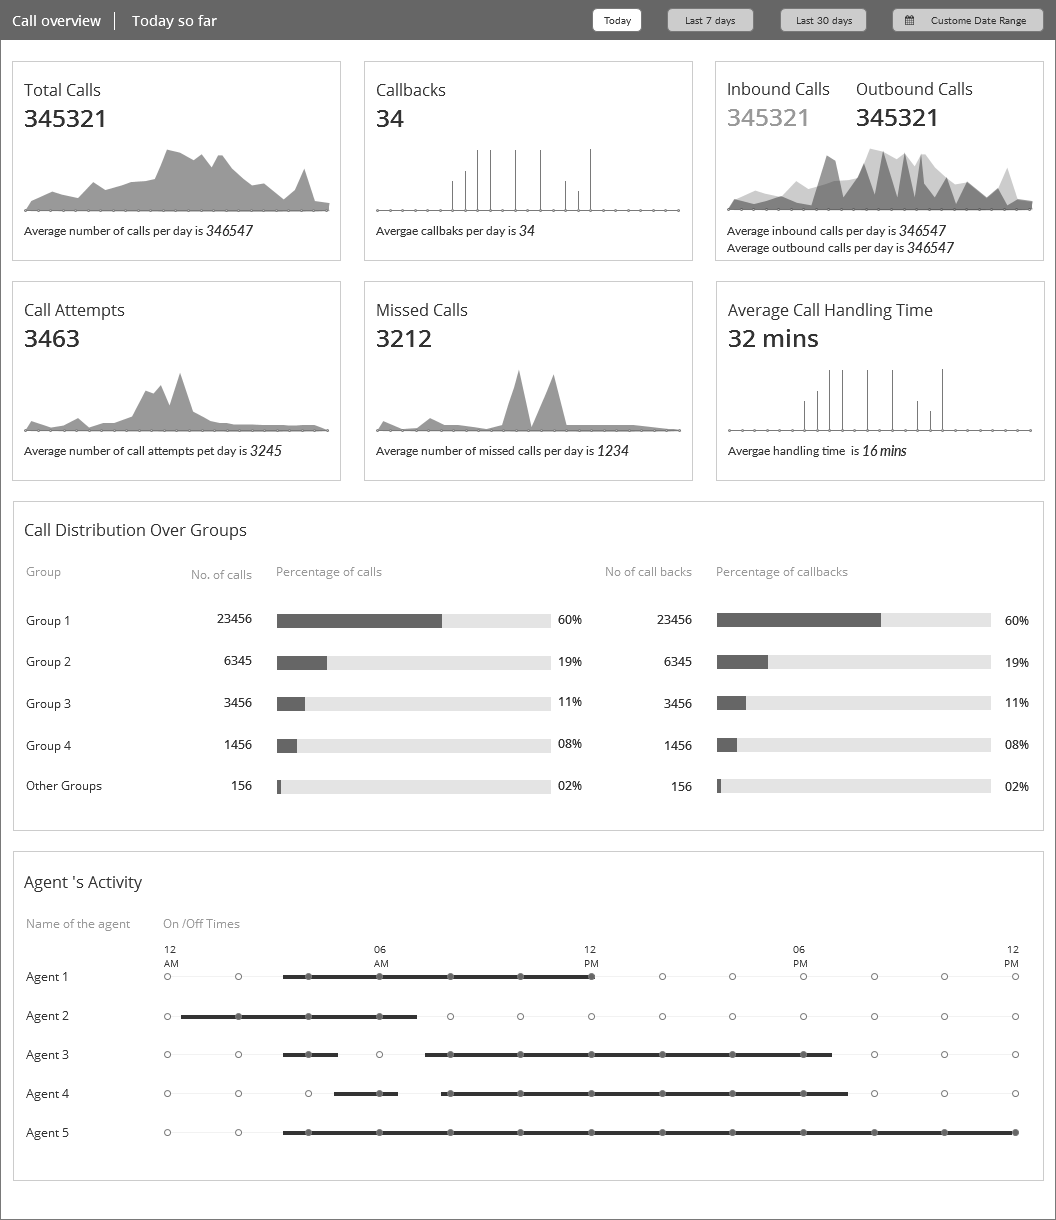
Level1: The Basics
It includes the data that is important for most of the use cases. These are the essential insights customers need to know often.
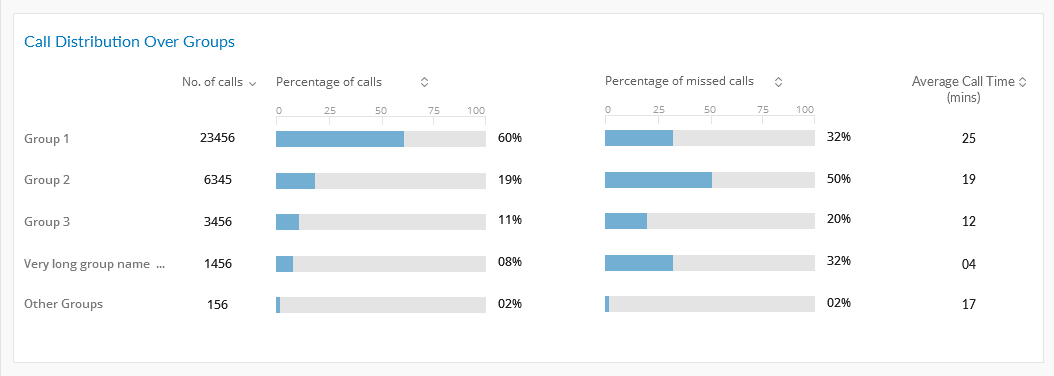
Level2: Activity of Groups
It provides an overview of the groups. Groups can be sales and support for contact centre operations. In logistics use case it can be locations, and in marketplace use case it can be product categories or channels.
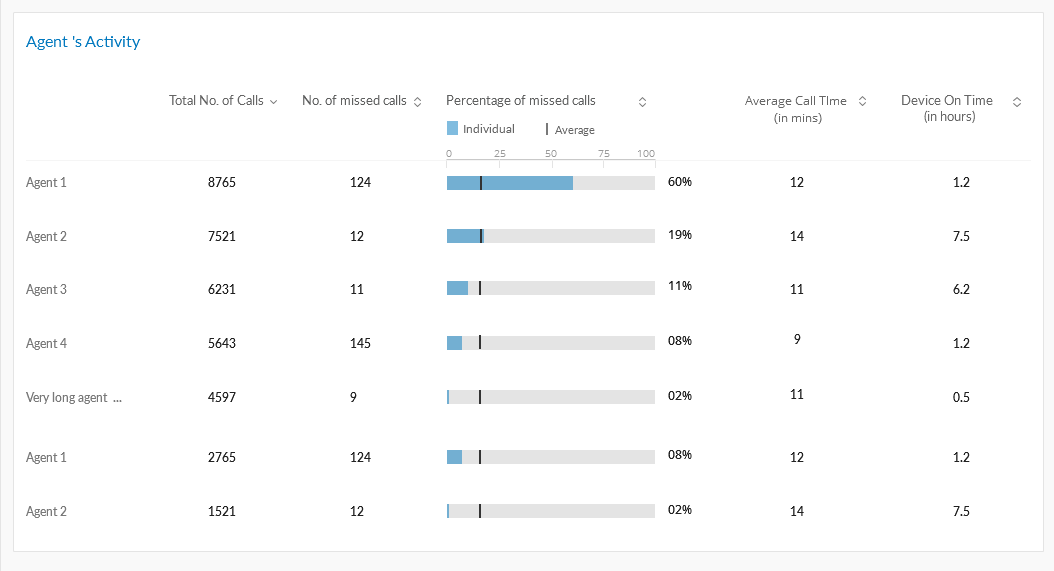
Level3: Activity of Agents
It helps customers to measure the individual performance. It also enables the comparison between the agents.
Customizations
One can choose to show or hide the sections. Even though we considered the option for customising the data withing the section, we decided not include at this point.
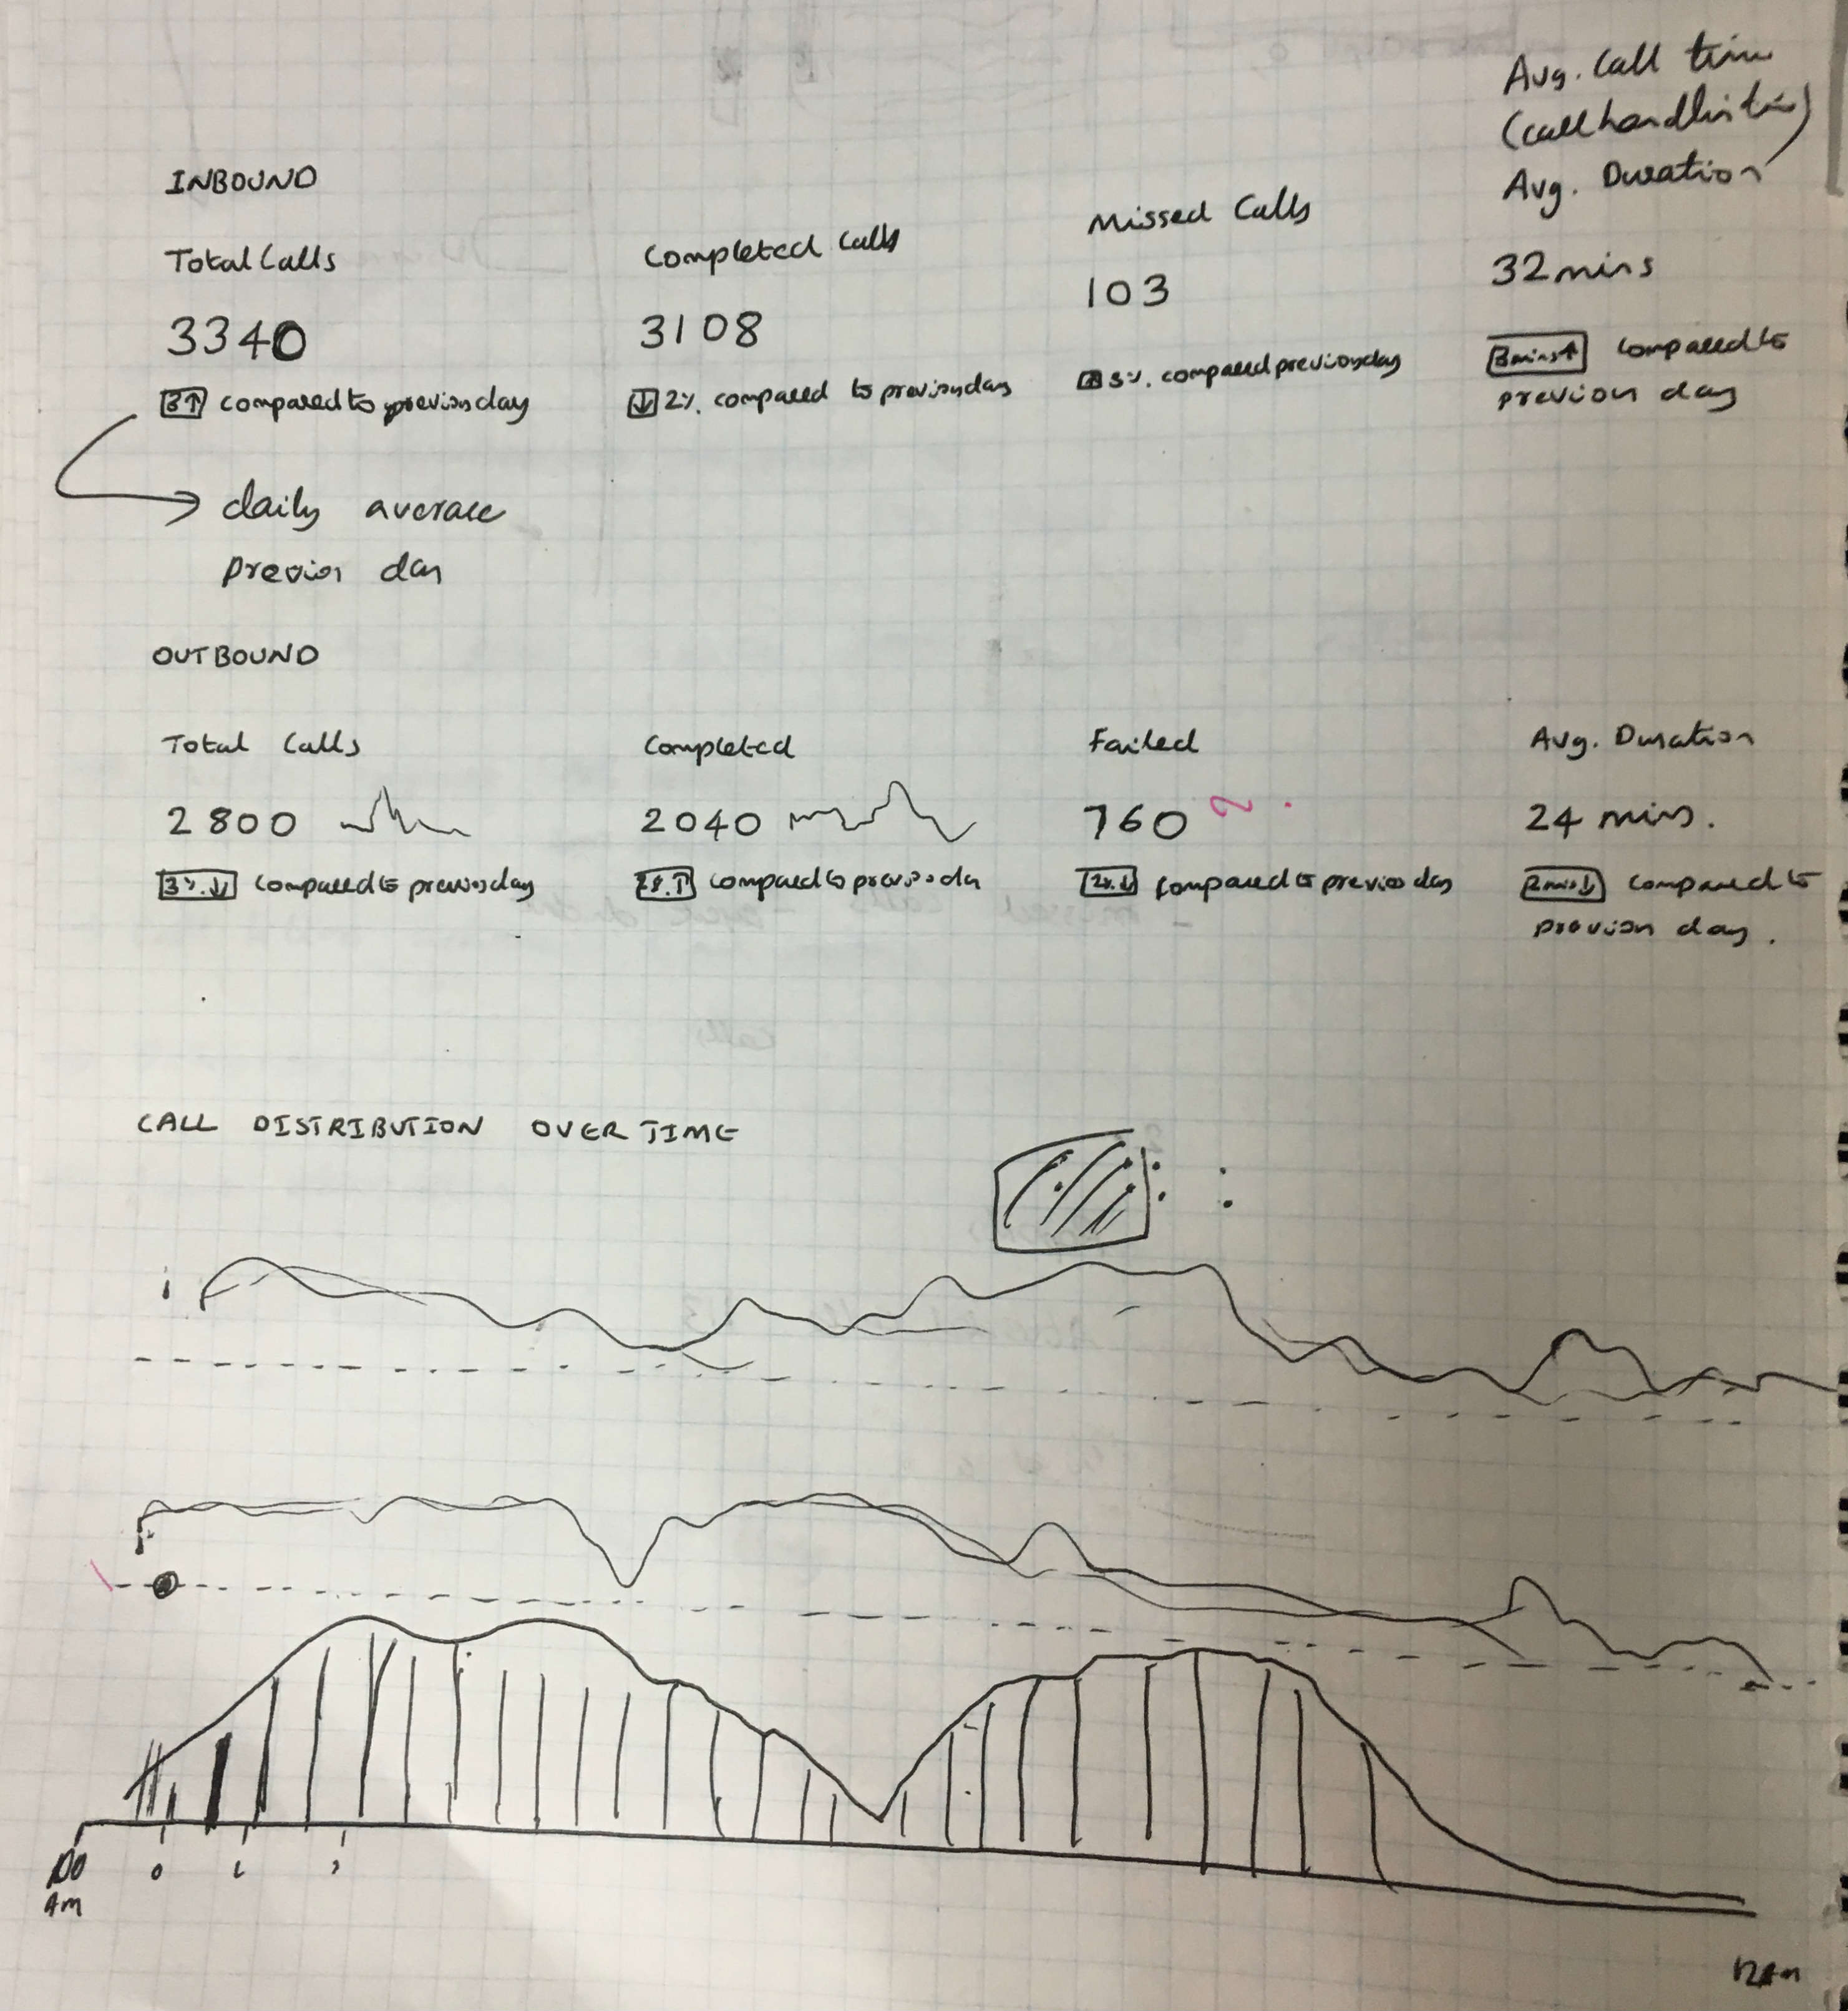
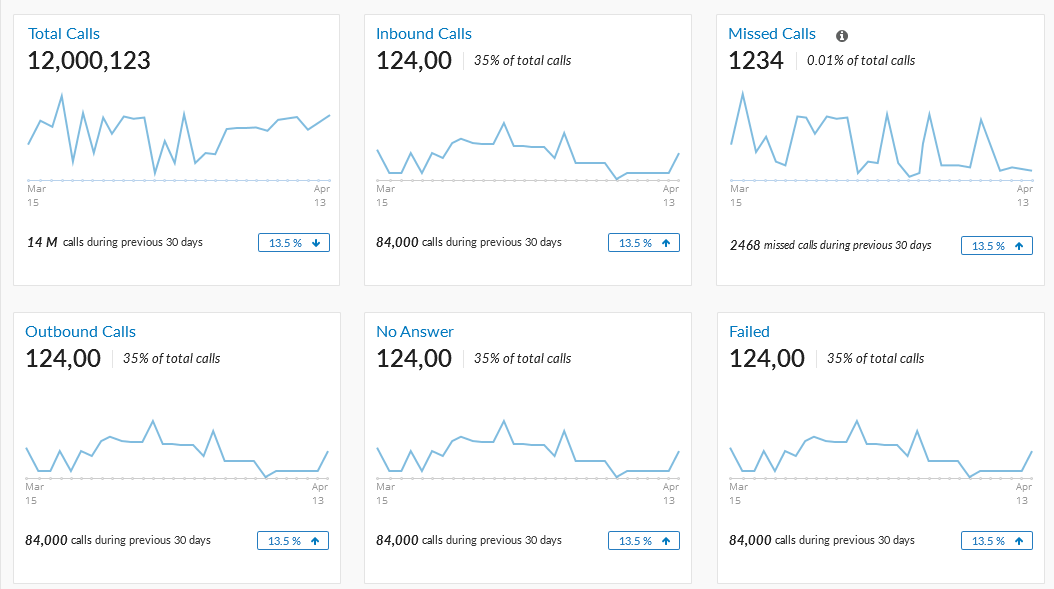
Compared to what?
People cannot take the decision based on the data alone. To make meaningful comparisons and derive insights they need context. The decision to include the graph for the call distributions and the ticker which compares the data displayed with a previous time frame help users to answer the question "compared to what?".The decision to include the graph for the call distributions and the ticker which compares the data displayed with a previous time frame are intended to answer the question "compared to what?".
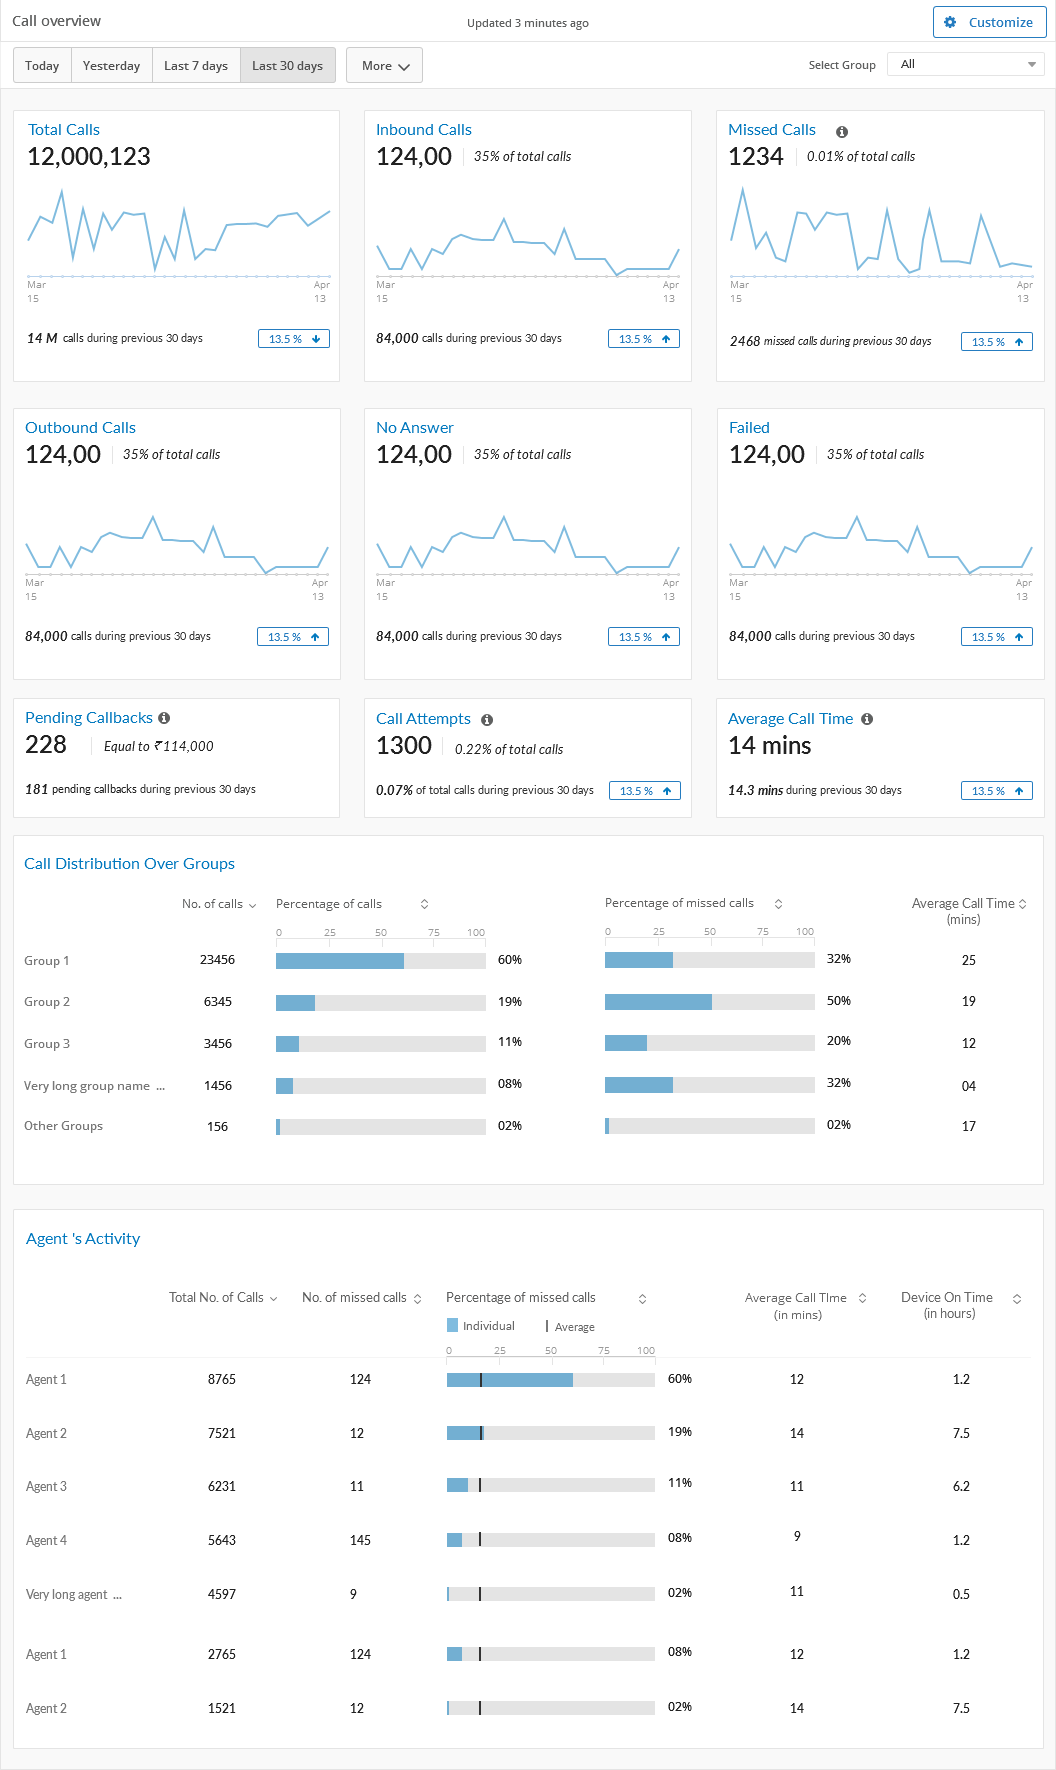
More information ≠ better insights
The information provided on the dashboard should not overwhelm the person who is looking at it. So we decided to show what is necessary to identify patterns and issues in the first place. The graphs reveal extra information whenever required.